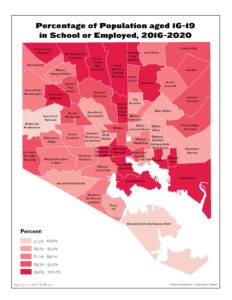
![Percentage of Population aged 16-19 in School or Employed (2020)](https://bniajfi.org/wp-content/uploads/2022/07/Sclemp20map-232x300.jpg)
Percentage of Population aged 16-19 in School or Employed (2020)
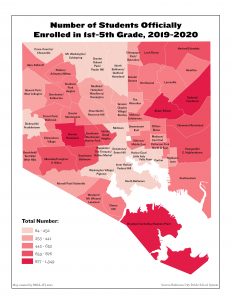
![Number of Students Officially Enrolled in 1st-5th Grade (2019-2020)](https://bniajfi.org/wp-content/uploads/2021/05/Eenrol20map-232x300.jpg)
Number of Students Officially Enrolled in 1st-5th Grade (2019-2020)
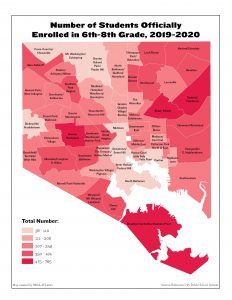
![Number of Students Officially Enrolled in 6th-8th Grade (2019-2020)](https://bniajfi.org/wp-content/uploads/2021/05/Menrol20map-232x300.jpg)
Number of Students Officially Enrolled in 6th-8th Grade (2019-2020)
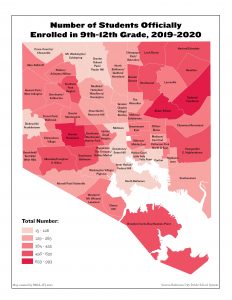
![Number of Students Officially Enrolled in 9th-12th Grade (2019-2020)](https://bniajfi.org/wp-content/uploads/2021/05/Hsenrol20map-232x300.jpg)
Number of Students Officially Enrolled in 9th-12th Grade (2019-2020)
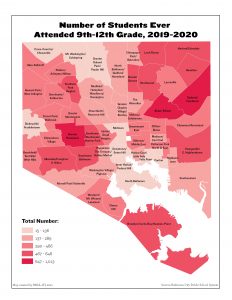
![Number of Students Ever Attended 9th-12th Grade (2019-2020)](https://bniajfi.org/wp-content/uploads/2021/05/Hsattend20map-232x300.jpg)
Number of Students Ever Attended 9th-12th Grade (2019-2020)
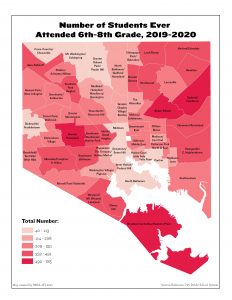
![Number of Students Ever Attended 6th-8th Grade (2019-2020)](https://bniajfi.org/wp-content/uploads/2021/05/Mattend20map-232x300.jpg)
Number of Students Ever Attended 6th-8th Grade (2019-2020)
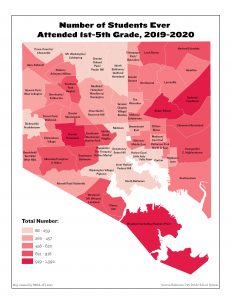
![Number of Students Ever Attended 1st-5th Grade (2019-2020)](https://bniajfi.org/wp-content/uploads/2021/05/Eattend20map-232x300.jpg)
Number of Students Ever Attended 1st-5th Grade (2019-2020)
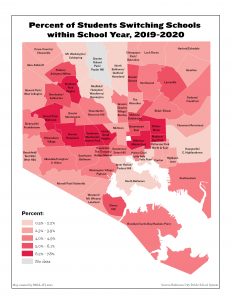
![Percent of Students Switching Schools within School Year (2019-2020)](https://bniajfi.org/wp-content/uploads/2021/05/Sclsw20map-232x300.jpg)
Percent of Students Switching Schools within School Year (2019-2020)
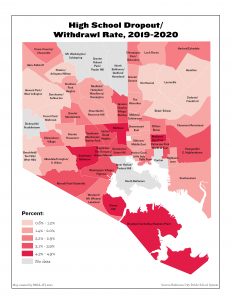
![High School Dropout/Withdrawl Rate (2019-2020)](https://bniajfi.org/wp-content/uploads/2021/05/Drop20map-232x300.jpg)
High School Dropout/Withdrawl Rate (2019-2020)
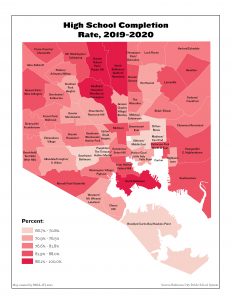
![High School Completion Rate (2019-2020)](https://bniajfi.org/wp-content/uploads/2021/05/Compl20map-232x300.jpg)
High School Completion Rate (2019-2020)
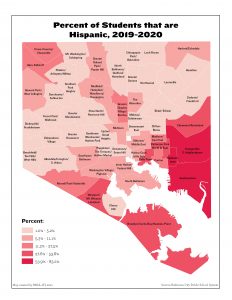
![Percent of Students that are Hispanic (2019-2020)](https://bniajfi.org/wp-content/uploads/2021/05/Hstud20map-232x300.jpg)
Percent of Students that are Hispanic (2019-2020)
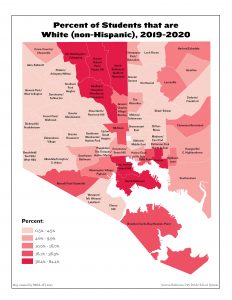
![Percent of Students that are White (Non-Hispanic) (2019-2020)](https://bniajfi.org/wp-content/uploads/2021/05/Wstud20map-232x300.jpg)
Percent of Students that are White (Non-Hispanic) (2019-2020)
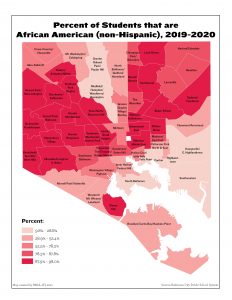
![Percent of Students that are African American (Non-Hispanic) (2019-2020)](https://bniajfi.org/wp-content/uploads/2021/05/Aastud20map-232x300.jpg)
Percent of Students that are African American (Non-Hispanic) (2019-2020)
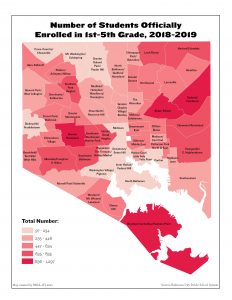
![Number of Students Officially Enrolled in 1st-5th Grade (2018-2019)](https://bniajfi.org/wp-content/uploads/2021/05/Eenrol19map-232x300.jpg)
Number of Students Officially Enrolled in 1st-5th Grade (2018-2019)
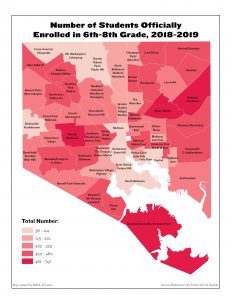
![Number of Students Officially Enrolled in 6th-8th Grade (2018-2019)](https://bniajfi.org/wp-content/uploads/2021/05/Menrol19map-232x300.jpg)
Number of Students Officially Enrolled in 6th-8th Grade (2018-2019)
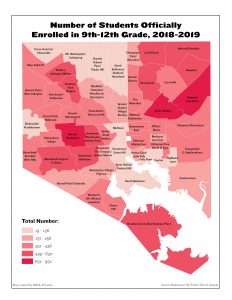
![Number of Students Officially Enrolled in 9th-12th Grade (2018-2019)](https://bniajfi.org/wp-content/uploads/2021/05/Hsenrol19map-232x300.jpg)
Number of Students Officially Enrolled in 9th-12th Grade (2018-2019)
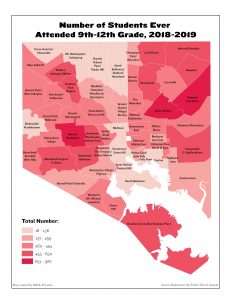
![Number of Students Ever Attended 9th-12th Grade (2018-2019)](https://bniajfi.org/wp-content/uploads/2021/05/Hsattend19map-232x300.jpg)
Number of Students Ever Attended 9th-12th Grade (2018-2019)
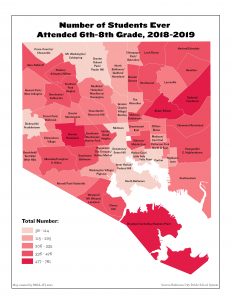
![Number of Students Ever Attended 6th-8th Grade (2018-2019)](https://bniajfi.org/wp-content/uploads/2021/05/Mattend19map-232x300.jpg)
Number of Students Ever Attended 6th-8th Grade (2018-2019)
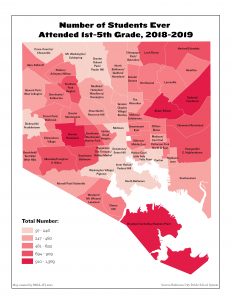
![Number of Students Ever Attended 1st-5th Grade (2018-2019)](https://bniajfi.org/wp-content/uploads/2021/05/Eattend19map-232x300.jpg)
Number of Students Ever Attended 1st-5th Grade (2018-2019)
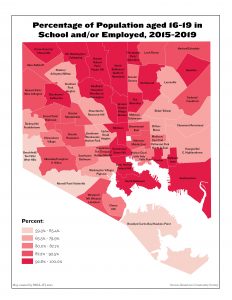
![Percentage of Population aged 16-19 in School and/or Employed](https://bniajfi.org/wp-content/uploads/2021/05/Sclemp19map-232x300.jpg)
Percentage of Population aged 16-19 in School and/or Employed
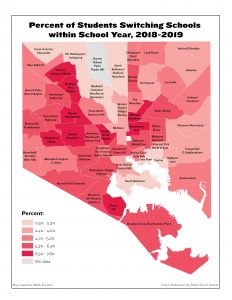
![Percent of Students Switching Schools within School Year (2018-2019)](https://bniajfi.org/wp-content/uploads/2021/05/Sclsw19map-232x300.jpg)
Percent of Students Switching Schools within School Year (2018-2019)
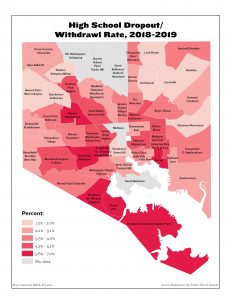
![High School Dropout/Withdrawl Rate (2018-2019)](https://bniajfi.org/wp-content/uploads/2021/05/Drop19map-232x300.jpg)
High School Dropout/Withdrawl Rate (2018-2019)
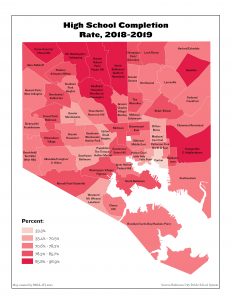
![High School Completion Rate (2018-2019)](https://bniajfi.org/wp-content/uploads/2021/05/Compl19map-232x300.jpg)
High School Completion Rate (2018-2019)
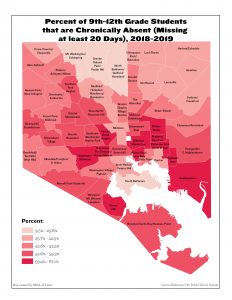
![Percent of 9th-12th Grade Students that are Chronically Absent (Missing at least 20 Days)](https://bniajfi.org/wp-content/uploads/2021/05/Abshs19map-232x300.jpg)
Percent of 9th-12th Grade Students that are Chronically Absent (Missing at least 20 Days)
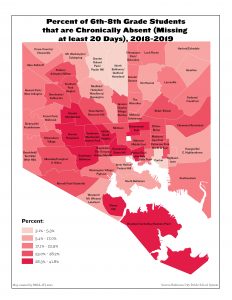
![Percent of 6th-8th Grade Students that are Chronically Absent (Missing at least 20 Days)](https://bniajfi.org/wp-content/uploads/2021/05/Absmd19map-232x300.jpg)
Percent of 6th-8th Grade Students that are Chronically Absent (Missing at least 20 Days)
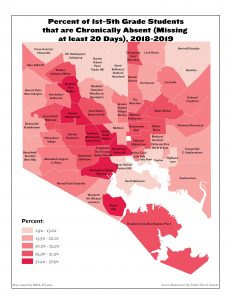
![Percent of 1st-5th Grade Students that are Chronically Absent (Missing at least 20 Days)](https://bniajfi.org/wp-content/uploads/2021/05/Abse19map-232x300.jpg)
Percent of 1st-5th Grade Students that are Chronically Absent (Missing at least 20 Days)
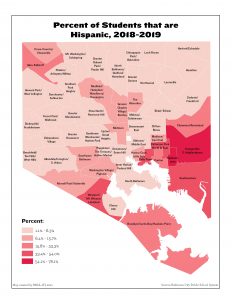
![Percent of Students that are Hispanic (2018-2019))](https://bniajfi.org/wp-content/uploads/2021/05/Hstud19map-232x300.jpg)
Percent of Students that are Hispanic (2018-2019))
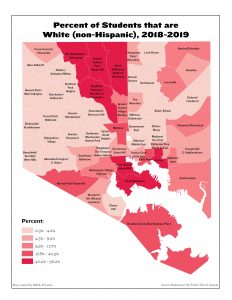
![Percent of Students that are White (Non-Hispanic) (2018-2019)](https://bniajfi.org/wp-content/uploads/2021/05/Wstud19map-232x300.jpg)
Percent of Students that are White (Non-Hispanic) (2018-2019)
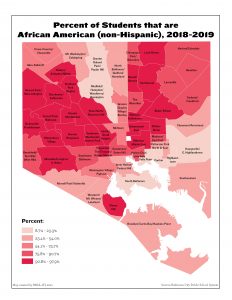
![Percent of Students that are African American (Non-Hispanic) (2018-2019)](https://bniajfi.org/wp-content/uploads/2021/05/Aastud19map-232x300.jpg)
Percent of Students that are African American (Non-Hispanic) (2018-2019)
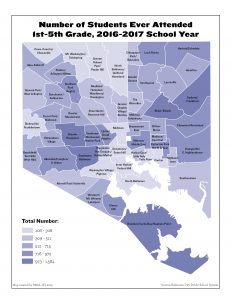
![](https://bniajfi.org/wp-content/uploads/2019/07/Eattend17map-232x300.jpg)
Number of Students Ever Attended 1st – 5th Grade
![](https://bniajfi.org/wp-content/uploads/2019/07/Hsattend17map-232x300.jpg)
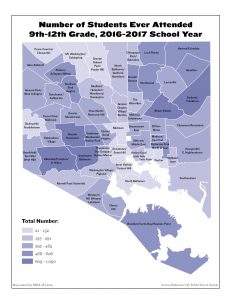
Number of Students Ever Attended 9th – 12th Grade
![](https://bniajfi.org/wp-content/uploads/2019/07/Mattend17map-232x300.jpg)
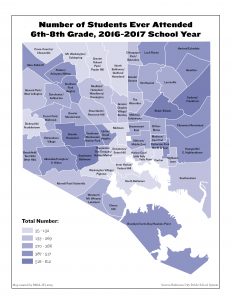
Number of Students Ever Attended 6th – 8th Grade
![](https://bniajfi.org/wp-content/uploads/2019/07/Palg217map-232x300.jpg)
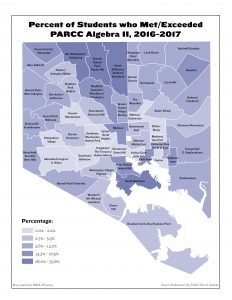
Percentage of Students who met or exceeded PARCC Algebra II
![](https://bniajfi.org/wp-content/uploads/2019/07/Palg117map-232x300.jpg)
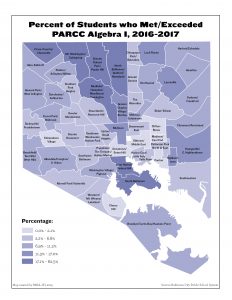
Percentage of Students who met or exceeded PARCC Algebra I
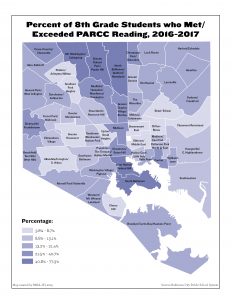
![](https://bniajfi.org/wp-content/uploads/2019/07/Pread817map-232x300.jpg)
Percentage of 8th Grade Students Passing PARCC Reading
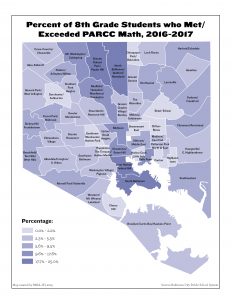
![](https://bniajfi.org/wp-content/uploads/2019/07/Pmath817map-232x300.jpg)
Percentage of 8th Grade Students Passing PARCC Math
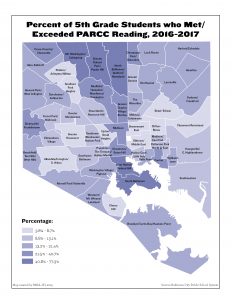
![](https://bniajfi.org/wp-content/uploads/2019/07/Pread517map-232x300.jpg)
Percentage of 5th Grade Students Passing PARCC Reading
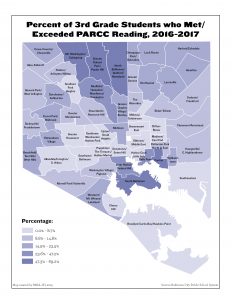
![](https://bniajfi.org/wp-content/uploads/2019/07/Pread317map-232x300.jpg)
Percentage of 3rd Grade Students Passing PARCC Reading
![](https://bniajfi.org/wp-content/uploads/2019/07/Pmath317map-232x300.jpg)
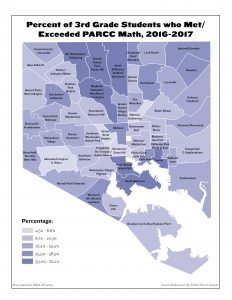
Percentage of 3rd Grade Students Passing PARCC Math
![](https://bniajfi.org/wp-content/uploads/2019/07/Hsenrol17map-232x300.jpg)
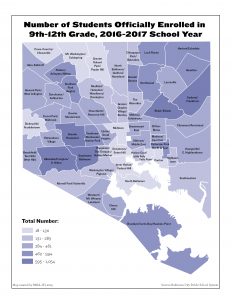
Number of Students Officially Enrolled in 9th – 12th Grade
![](https://bniajfi.org/wp-content/uploads/2019/07/Menrol17map-232x300.jpg)
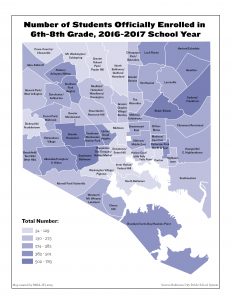
Number of Students Officially Enrolled in 6th – 8th Grade
![](https://bniajfi.org/wp-content/uploads/2019/07/Eenrol17map-232x300.jpg)
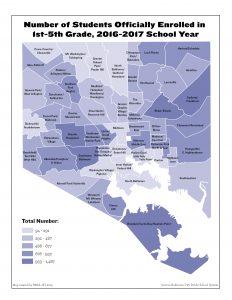
Number of Students Officially Enrolled in 1st – 5th Grade
![](https://bniajfi.org/wp-content/uploads/2019/07/Sclemp17map-232x300.jpg)
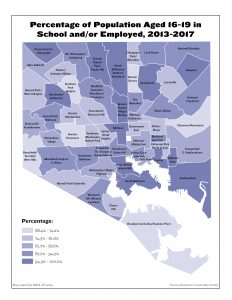
Percentage of Population aged 16-19 in School and/or Employed
![](https://bniajfi.org/wp-content/uploads/2019/07/Compl17map-232x300.jpg)
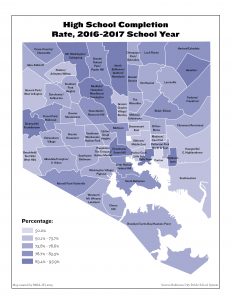
High School Completion Rate
![](https://bniajfi.org/wp-content/uploads/2019/07/Drop17map-232x300.jpg)
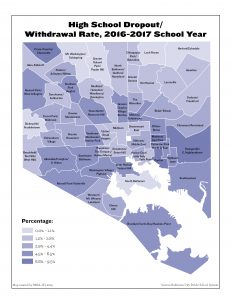
High School Dropout/Withdrawal Rate
![](https://bniajfi.org/wp-content/uploads/2019/07/Abshs17map-232x300.jpg)
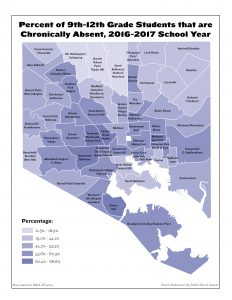
Percent of 9th-12th Grade Students that are Chronically Absent (Missing at least 20 days)
![](https://bniajfi.org/wp-content/uploads/2019/07/Absmd17map-232x300.jpg)
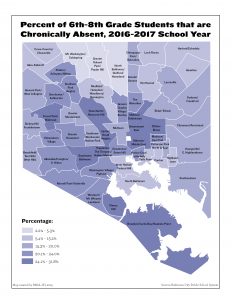
Percent of 6th-8th Grade Students that are Chronically Absent (Missing at least 20 days)
![](https://bniajfi.org/wp-content/uploads/2019/07/Abse17map-232x300.jpg)
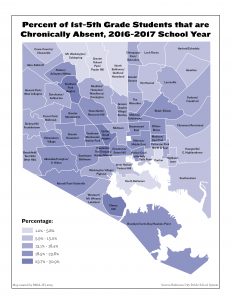
Percent of 1st-5th Grade Students that are Chronically Absent (Missing at least 20 days)
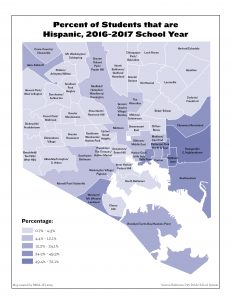
![](https://bniajfi.org/wp-content/uploads/2019/07/Hstud17map-232x300.jpg)
Percent of Students that are Hispanic
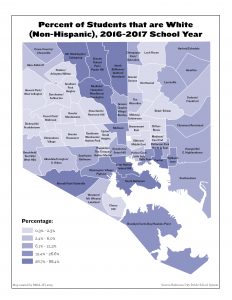
![](https://bniajfi.org/wp-content/uploads/2019/07/Wstud17map-232x300.jpg)
Percent of Students that are White (non-Hispanic)
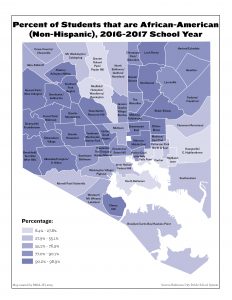
![](https://bniajfi.org/wp-content/uploads/2019/07/Aastud17map-232x300.jpg)
Percent of Students that are African American (non-Hispanic)
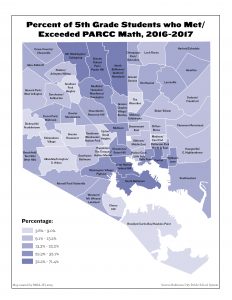
![](https://bniajfi.org/wp-content/uploads/2019/07/Pmath517map-232x300.jpg)
Percentage of 5th Grade Students Passing PARCC Math